2018 State of B2B Content Consumption and Demand Report
It’s here – the big one, the data-packed, no-nonsense guide to our chamber of data on B2B consumption and demand on the NetLine network.
Day in and day out, our network accepts data on the thousands of professionals who have requested content. Whether it was attending a webinar, downloading an eBook, or requesting the classic white paper, professionals at every job level utilized content to learn and more importantly, to inform their important business decisions. These transactions yield a bevy of information that we can nerdishly analyze and share with you, dear marketer friend.
Our technology makes it easy to gather a professional profile for users who request content on our network – 18 points of data to be exact. (And they don’t even have to type that much to do it!) The form validates company information dynamically and remembers users who come back for more. As marvelous as this is for clients and users of the NetLine Portal, it’s an opportunity to share specific insights for the greater good of the content marketing community (that’s you).
Info you can use without hurting your brain
This year, we took this compulsion to review our data and decided to deliver it in a way that would be visually engaging (read: easy on the eyes), while providing insights that are relatable and actionable. With so many reports floating around the interwebs, we wanted to give marketers a report they can actually utilize as a tool. Even the busiest marketer can skim to the ‘Takeaway’ sections and find out what our data means for the plan:
Here’s an example ‘Takeaway’ from the By the People section that followed a series of charts and data points on consumption and demand:
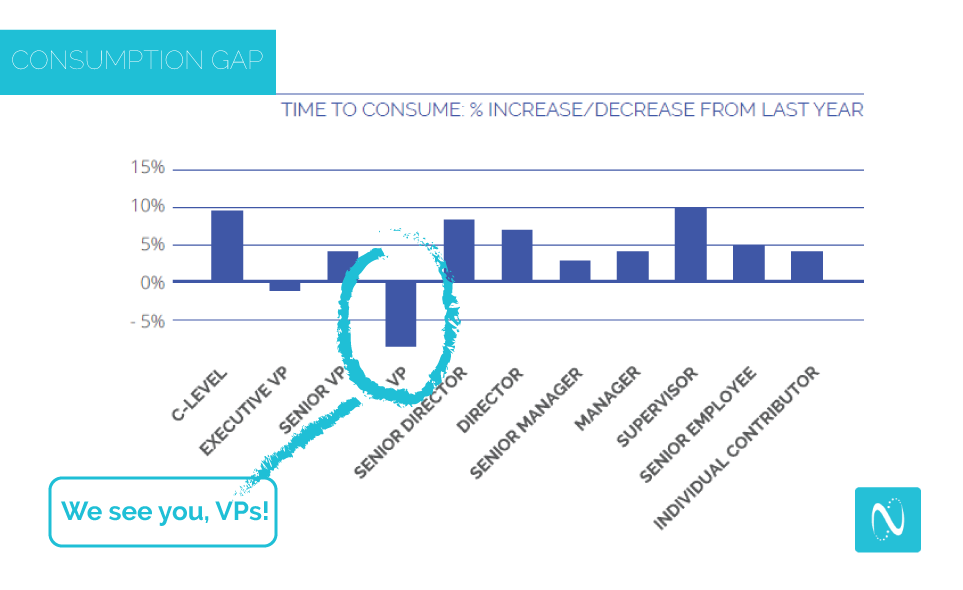
TAKEAWAY: At enterprise companies, the scale and complexity of the org chart leaves a C-level employee, Executives, Directors and Managers with increasingly less time for follow ups and discovery research. See beyond the C-suite – target influencers in the organization who have the time and vested interest in consuming content that advances the objectives typical of their roles. Clearly the top theme among job levels concerns time management and optimization of productivity. Marketers can appeal to multiple influential Job Levels by serving up content that humanizes the reader’s pain points, resonates through humanization, and offers a solution to their needs.
This one is great for those marketers who are deploying content to C-level professionals and not seeing much ROI. Combined with the fact that nearly 30% of the active audience are Individual Contributors, it’s a wakeup call to evaluate content and targeting relative to job level.
Take the guess work out of what your content is doing
Moving down the org chart and comparing our data to last year, we noticed a 7% decrease in the time it took for VPs to read the content they requested. That sparked some thoughts for us – VPs seem to be wearing a few hats if they’re consuming content more voraciously than last year. Are they making decisions, influencing decisions and conducting research? If so, this job level might be worth some extra attention. The report then showcases the content themes that each job level is consuming, so a marketer could (for example) emphasize content production techniques that appeal to VPs, then implement a targeting strategy accordingly.
See what we’re saying?
We did a lot of thinking so you aren’t squinting at pages of charts going, “Ok, so… what?”
Cater to convenience without sacrificing value
Beyond the job level profiles, the 2018 report delves into consumption and demand data by the company size, by the industry and serves up individual user insights to help marketers remember that “users” are people, who are unique and have interests and do other stuff besides work. It’s easy to slip into a pattern of talking about personas vs. people, but this insight is one of the ways we encourage marketers to break out of that pattern.
Then we went on to explore more about the actual people behind the downloads – a person is certainly more than their title or their company, so it helps to know a bit more about what they like to make sure content makes an impression.
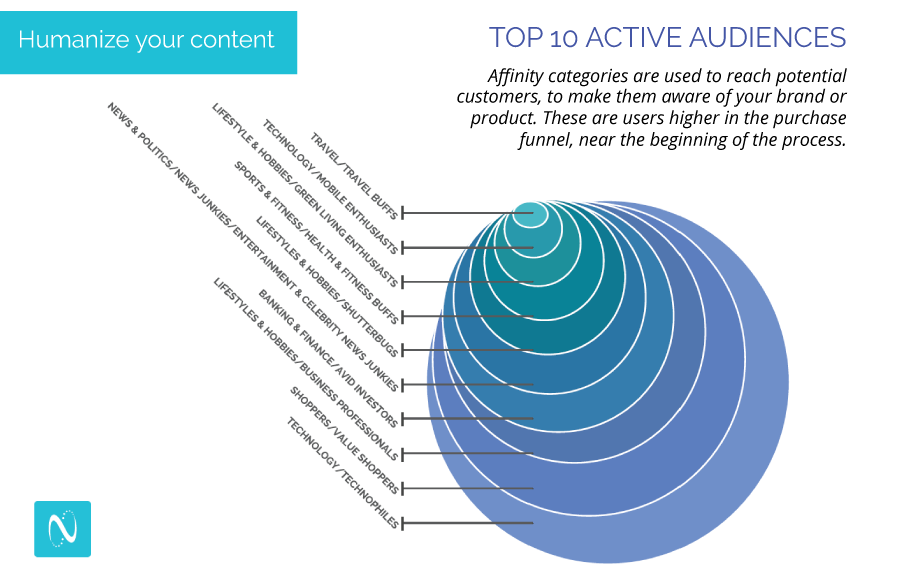
The top profile by interests (as per Google’s extrapolation of known-users) is Technology/Technophiles, followed by Shoppers, Lifestyles & Hobbies/Business Professionals. While this isn’t too surprising based upon the Words at Work section of the report and some call outs on thematic interests across the top downloads, it does provide a secondary insight into what else users are looking at or might be looking for. Relating content to any one of these interests can be a simple way of making your brand stand out or catch the eye of a particular audience.
With NetLine’s 2018 State of B2B Content Consumption and Demand Report, marketers can gain a competitive advantage based on real data and analysis of actual goings-on in the content universe. Check it out for free by clicking here to download your copy today.